Optimization Part 3 - Using Unreal Insights
In Part 2 we made a test environment and look at stats usage. Here we use Unreal Insights to determine what specifically is making the project run slow.
Using Unreal Insights
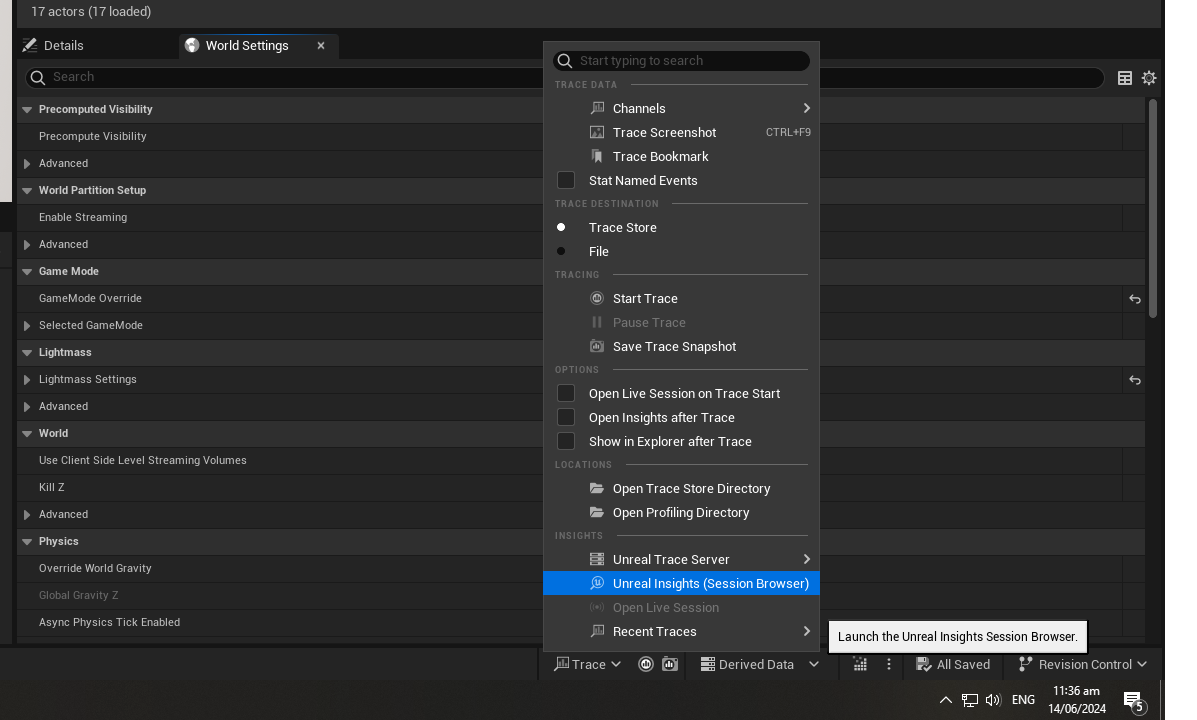
Unreal Insights is a tool for measuring performance of Unreal Engine applications. Unreal Insights collects and stores data about the runtime state of the game which can then be viewed. The data about one session of the game is called a trace. Traces are stored in a directory called the trace store. The Unreal Insights Session Browser shows traces in the trace store and allows you to choose and open a trace in the Unreal Insights program. To open the session browser use this option from the trace menu at the bottom of the main editor window:
The session browser shows a window like this:
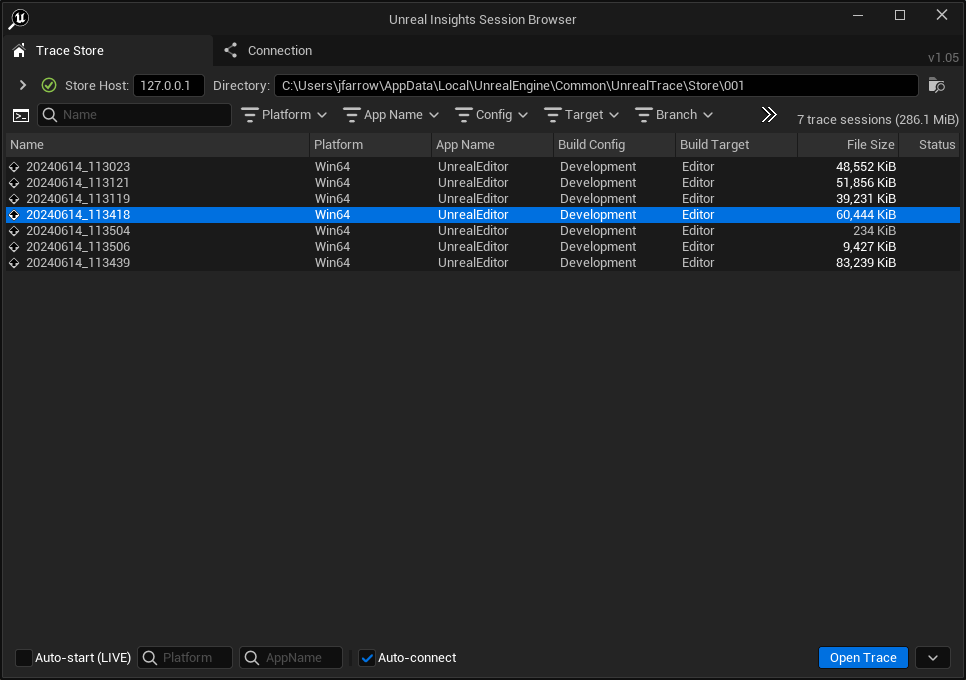
From here you can double-click on a session to open it in the Unreal Insights application. If you tick the "Auto-start (LIVE)" checkbox in the bottom left corner then the Unreal Insights application will load and start analysing the data as soon as tracing starts.
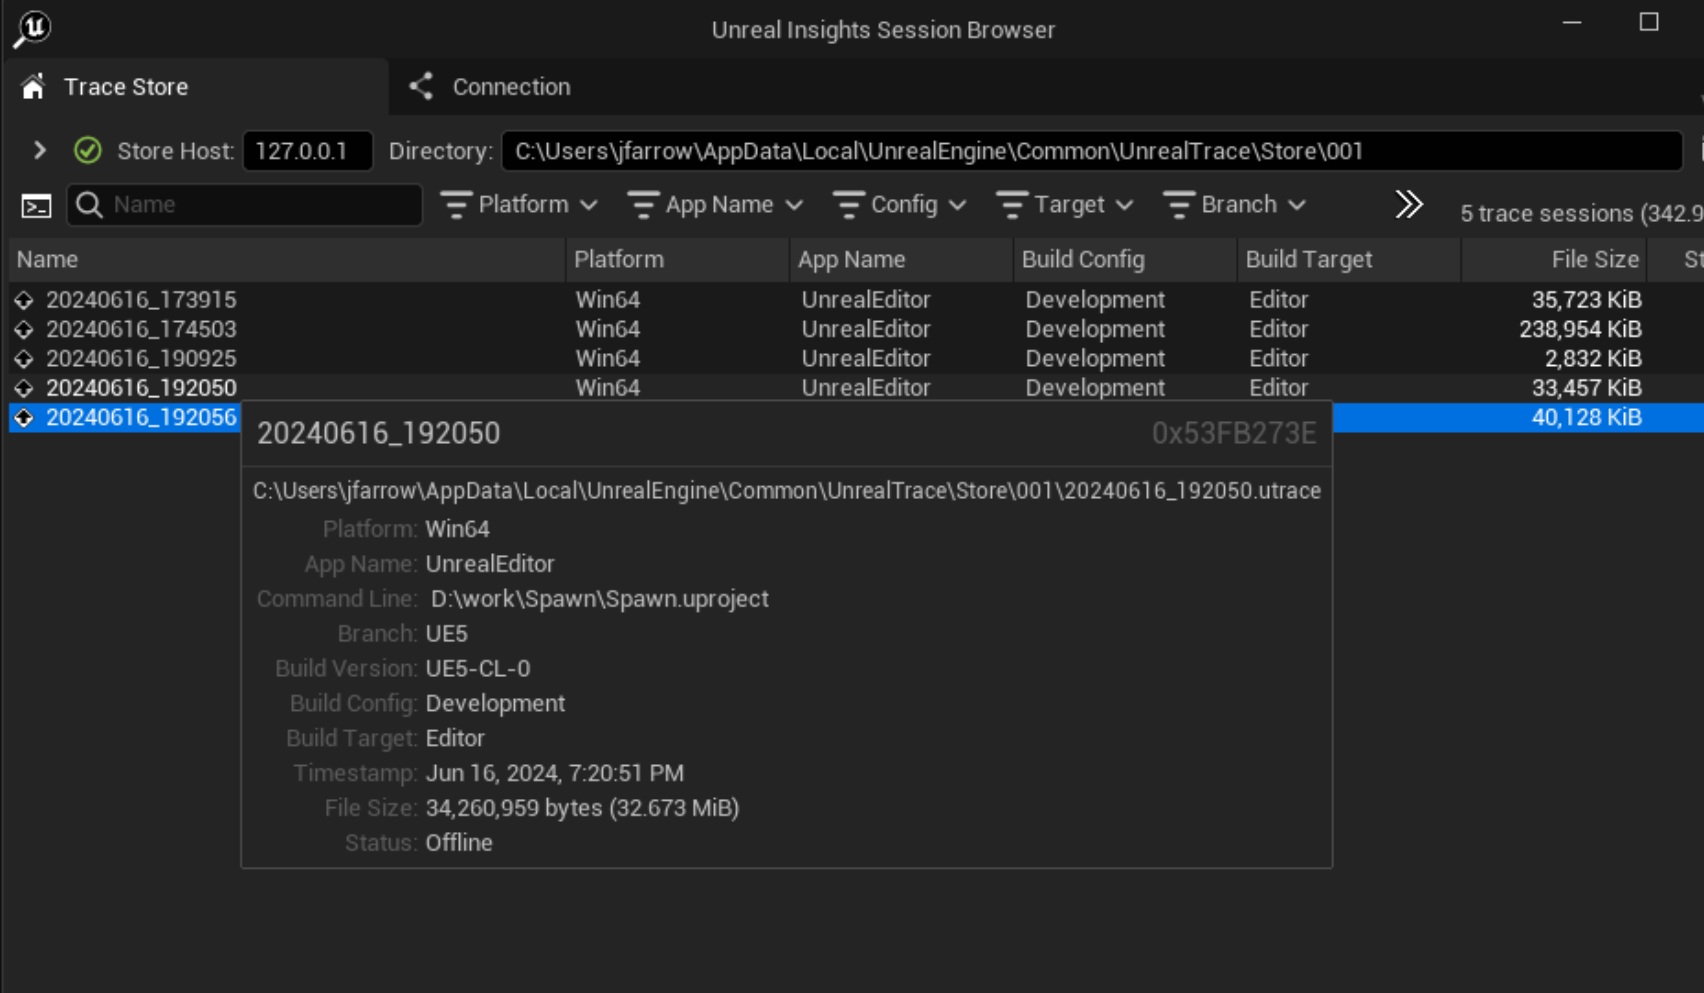
If you mouse over the session you can see some useful related information such as the complete command line if the game was a launched as a separate process:
Collecting traces manually
To collect trace data press the Start Trace button at the bottom of the screen:

This will turn the button red for the duration of the trace. Press the button again to turn off tracing.
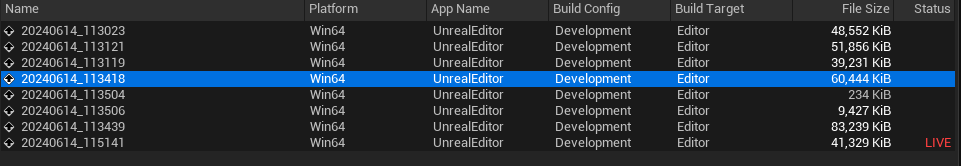
While the trace is running a newly created session will appear in the session browser window (if it is open) with the word "LIVE" next to it.
As soon as you press the trace start button capturing of trace data begins. If you press the button while the game is not running you are capturing trace data about the editor itself. If you then start the game as a separate process, for example by using the "Standalone Game" option, this will start another separate trace which will also appear in the session browser window with "LIVE" next to it. If you start the game running in the same process as the editor, for example using the "New Editor Window (PIE)" option the trace data for the game and the editor will be in the same trace file.
Collecting traces automatically
If the Unreal Insights session browser window is open some game configurations turn will start tracing automatically, for example opening the session browser and then launching the game using the "Standalone Game" option will start tracing whereas launching it in a "New Editor Window (PIE)" option will not.
Analysing traces
If we want to capture data for an entire game session from the start, we can use the following steps:
- setting the "Auto-start (LIVE)" checkbox in the Unreal Insights session browser window to checked
- setting the play mode to "Standalone Game"
- running the game
This will open the Unreal Insights window and immediately being displaying data.
If you start the game in Standalone mode and the later press the Trace button this creates a new trace session but it is tracing the editor not the standalone game.
Tracing the test program
If we open the session browser then run the test project from the editor in standalone mode for a minute or so this creates a trace file which we can open from the session browser.
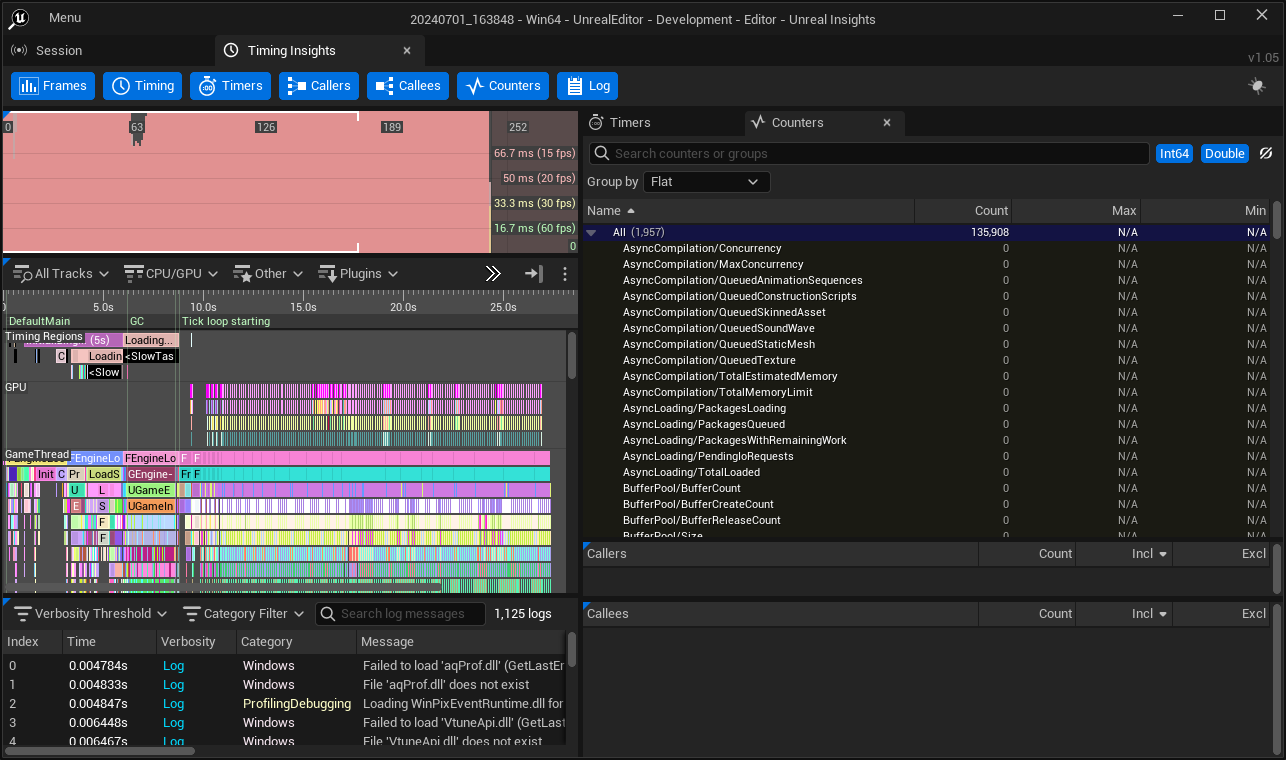
This opens the Unreal Insights application like this:
Timing Events
The Timing view and other views show what are called timing events. These broadly correlate to functions but they are not the same.
Looking at this engine code:
void FRendererModule::BeginRenderingViewFamilies(FCanvas* Canvas, TArrayView<FSceneViewFamily*> ViewFamilies)
{
	TRACE_CPUPROFILER_EVENT_SCOPE(BeginRenderingViewFamily);
	check(Canvas);
	for (FSceneViewFamily* ViewFamily : ViewFamilies)
	{
		check(ViewFamily);
		check(ViewFamily->Scene == ViewFamilies[0]->Scene);
	}
	...
}
Together with what we see in Timing view:
![]()
Looking at this an other code we can see that:
- these
TRACE_CPUPROFILER_EVENT_SCOPEmacros are placed so as best to measure performance - not every function as such a macro
- the name of the timing event "BeginRenderingViewFamily" is not the same as the name of the function "BeginRenderingViewFamilies"
- some functions have more than one event scope
- even in one function event scopes can be nested
Views
The image above shows the Timing Insights tab. This includes the row of buttons which is used to enable or disable the various views:

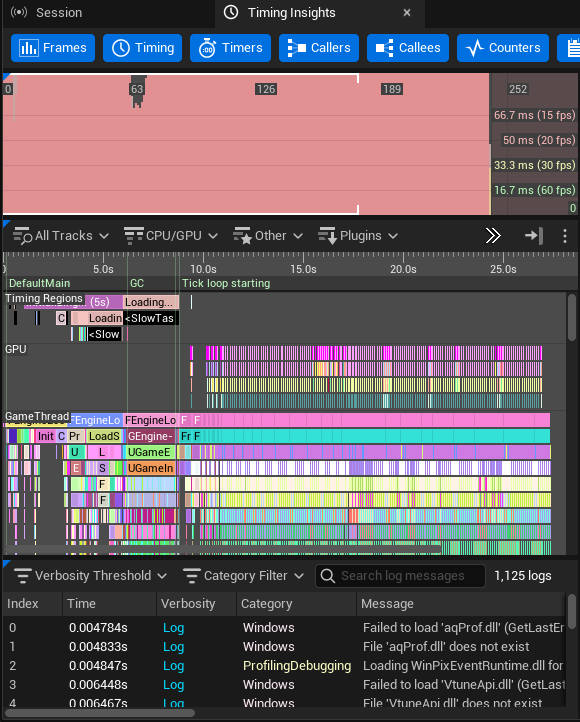
For example the Frames, Timing and Log windows are all stacked vertically on the left hand side of the window like so:
If we want to focus on one particular view, say the Frames panel, we can click on the buttons for the Timing and Log views to turn them off, in which case we get a bigger Frames view:
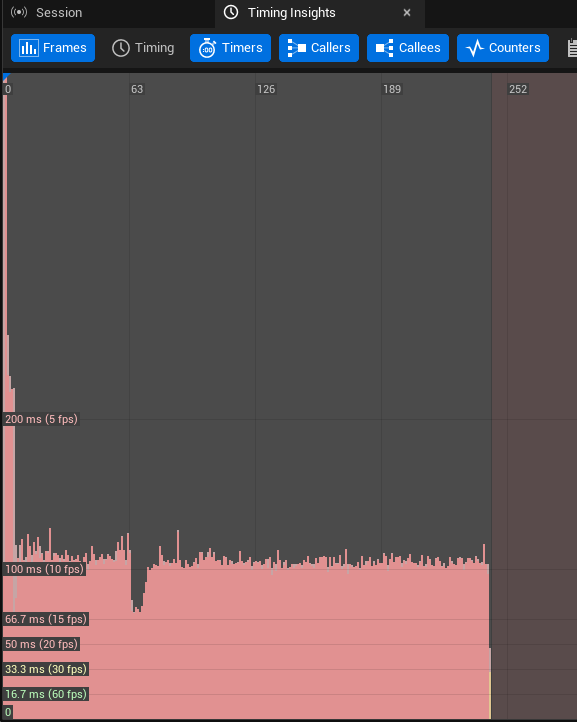
The Frames View
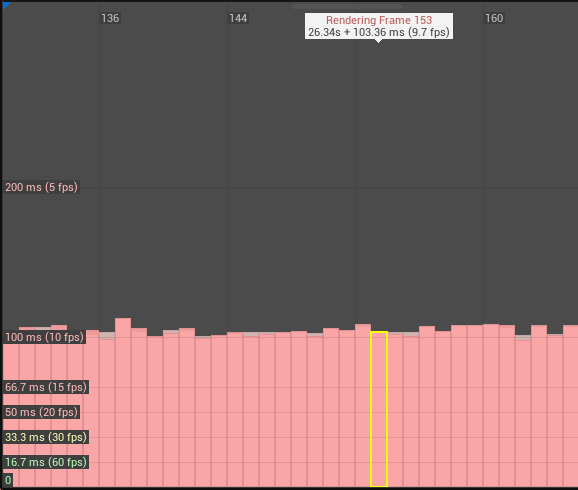
If we look at the top left view we see this:

This shows that all of the frames exceed the 16.7ms frame time we need to have 60 fps, indeed we don't even get 15 fps. A more reasonable result should look like the one below, where the great majority of frames are under 16.7 ms.
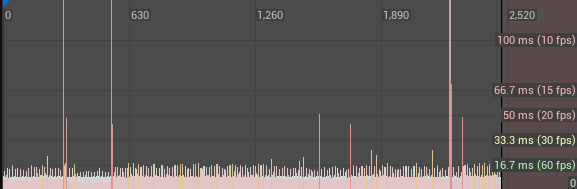
Looking at just the frames view from our test project:
We can see:
- the first few frames were very long as the project loaded
- after that the project settled down to around 10 fps
- looking at the top of the view we see we captured data on 252 frames, numbered 0 .. 251
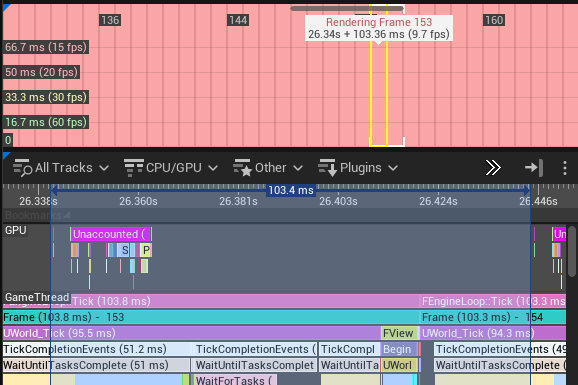
We can also use the middle mouse button to zoom in and out, and to select a particular frame and display summary timing information at the top of the view:
This is super useful because if we have the Frames and Timings views open together, selecting a particular frame in the Frames view focuses the Timings view to that frame:
The Timings View
The Timings view looks like this:
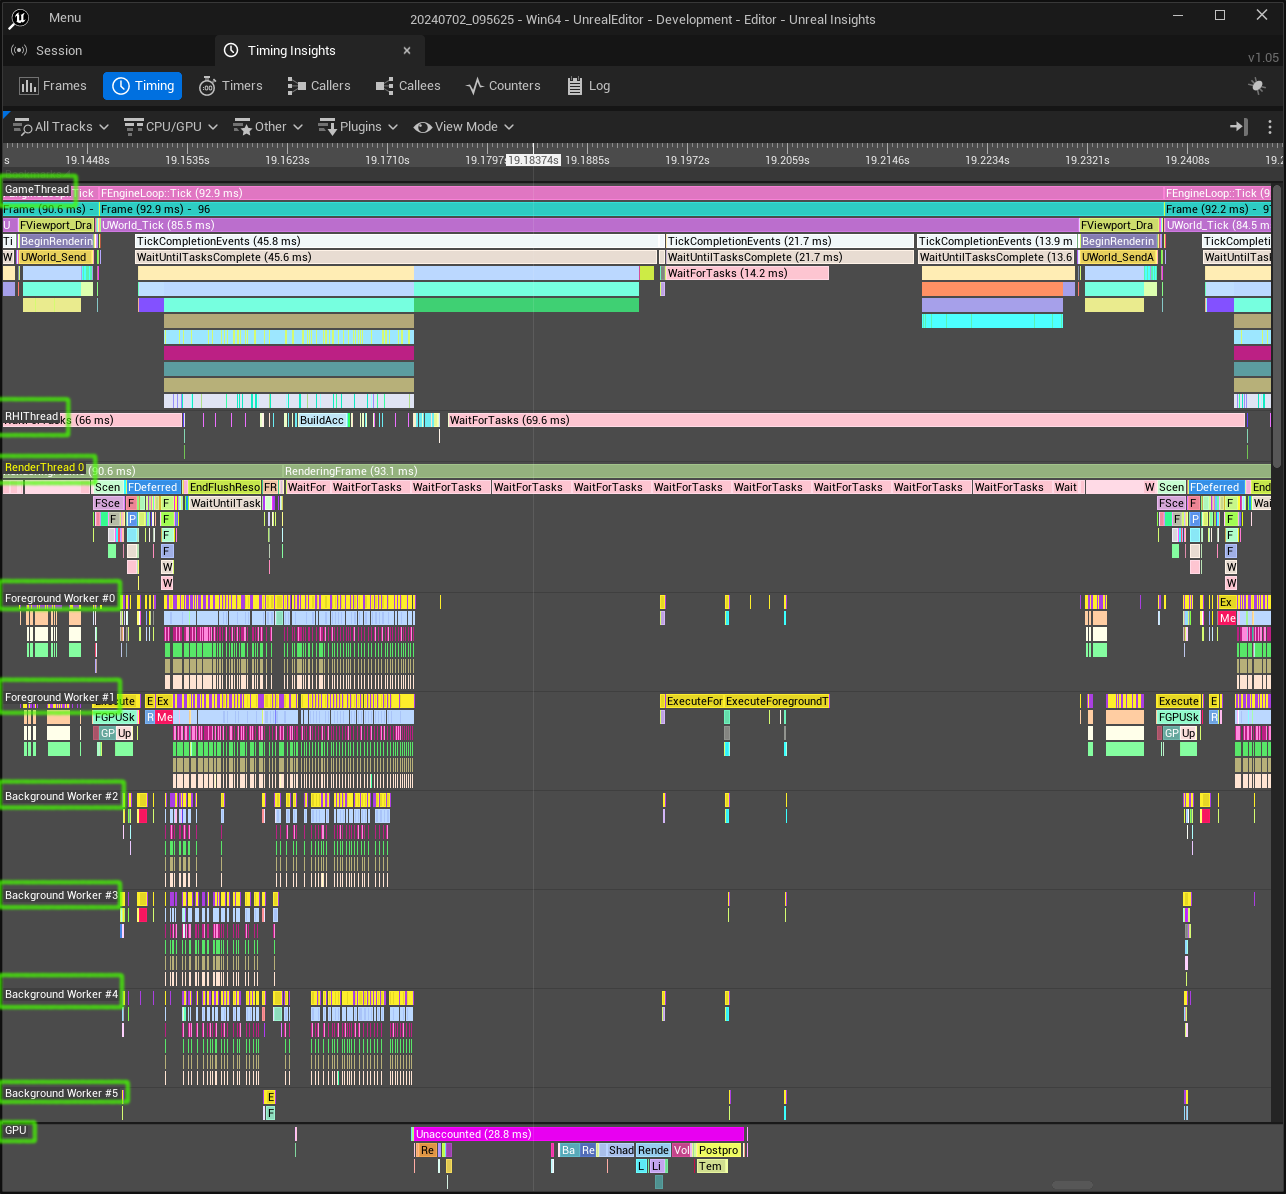
Time measurements go across the view left to right and tracks (i.e. threads, highlighted in green) go down the view. You can right-click a specific track label to pin it at the top or the bottom of the view or just leave it in the central scrolling area. In this picture the GPU track is pinned to the bottom of the view so it remains in place when central part is scrolled vertically.
Ways to navigate this view:
- holding the left mouse button down and moving the mouse drags the moves the timeleft horizontally and the scrollable middle area vertically
- scrolling the mouse wheel up and down zooms in and out on the element under the mouse
- holding shift while scrolling the mouse wheel up and down moves the view left and right
- double clicking an element highlights that element by making all other elements transparent
- pressing C compresses the view vertically to make data from more tracks visible
- pressing Y toggles display of GPU threads
- pressing U toggles display of CPU threads
- using the All Tracks menu (under the Frames button) you can enable Game Frames to and pin it at the top to always display which frame we are looking at
- Ctrl + double left mouse click on an element sets the time range to the start and end of that event. This limits the data in other windows such as the Callees window to that time range. This can also be done by pressing Enter or right-clicking and choosing "Select Time Range of Event"
Looking at the Game Thread at the top of this view:
We can see each timing event visualized as a colored bar. Beneath each bar are other bars representing the events which occured within the above event.
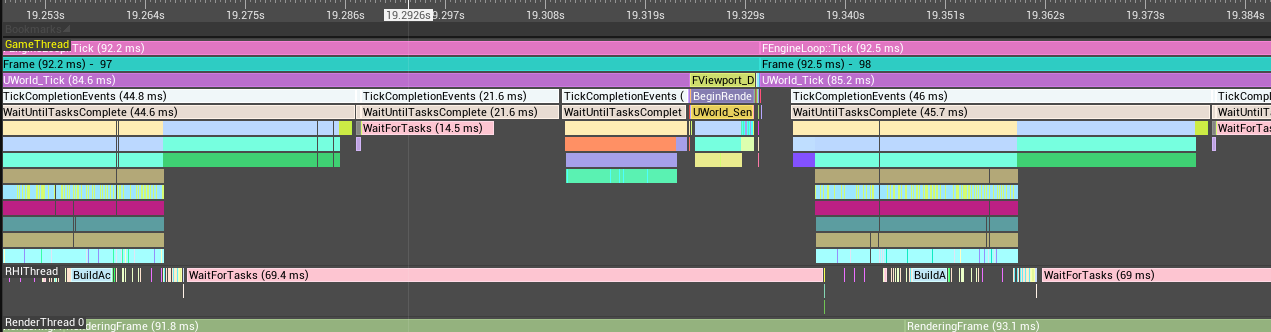
Looking at the green line we see the frame took 92.2ms to evaluate. Zooming in a bit more we can see that 92.2ms
was made up to 84.5ms in the UWorld_Tick() function and 7.2ms in the FViewport_Draw() function.
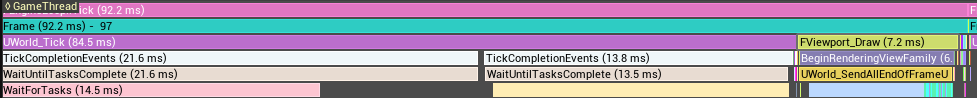
This clearly shows that the slowness of the game is due to delays in ticking the objects in the world rather than delays in rendering them.
Later on we will have a detailed look at what is going on in the UWorld_Tick() function, but firstly
we cover the use of some of the other views.
The Caller and Callees views
If we enable the Frames, Timing, Caller and Callees views, then zoom in the Frames view a bit and double click frame 100 we see this:
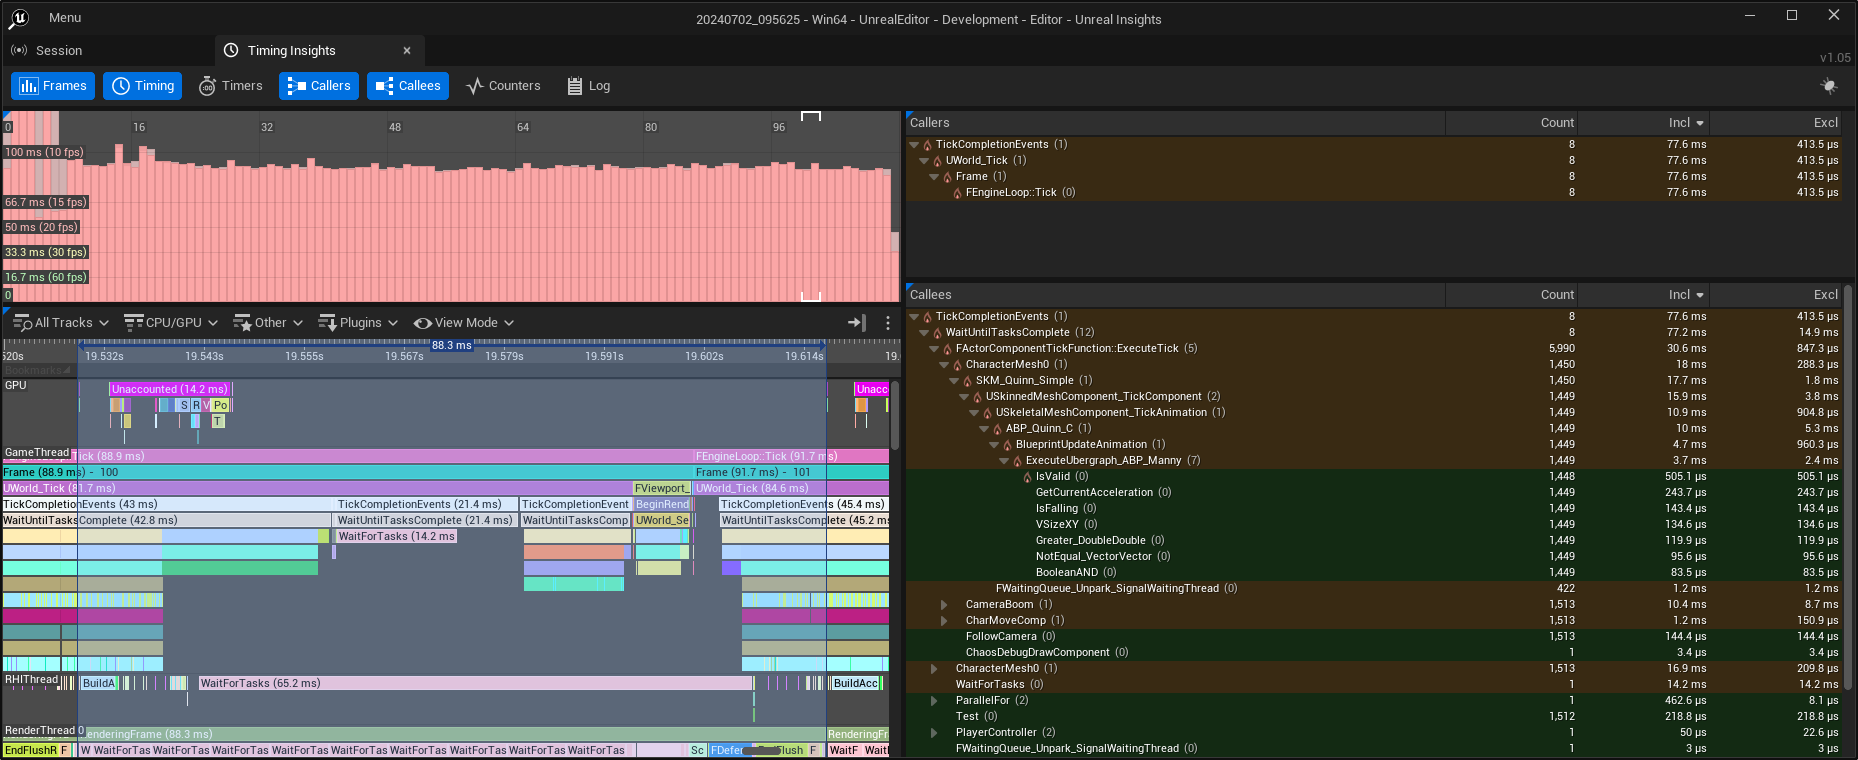
The blue area on the Timing view is the selected time range, defined when we double clicked on the frame in the Frame view. This can be changed by selecting a timing event in the Timing view and pressing Enter or right-clicking it and choosing "Select Time Range of Event".
The selected time range determines what functions appear in the Caller and Callee views.
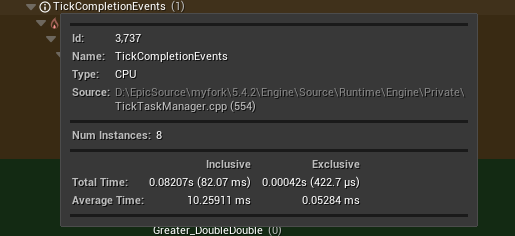
Looking at the Callees window we see lines like these:

We can also mouseover each icon at the start of each line to see more information, for example the source code line of the function:
The columns on the Callee view show:
- Count - the number of times this function was called
- Incl - the time spent in this function including functions called by that function
- Excl - the time spent in this function excluding functions called by that function
The inclusive and exclusive times are the total for all calls to that function. To display the times per call, display the column "Average Inclusive Time (ms)" or "Average Exclusive Time (ms)". You can right click the headings and display additional columns
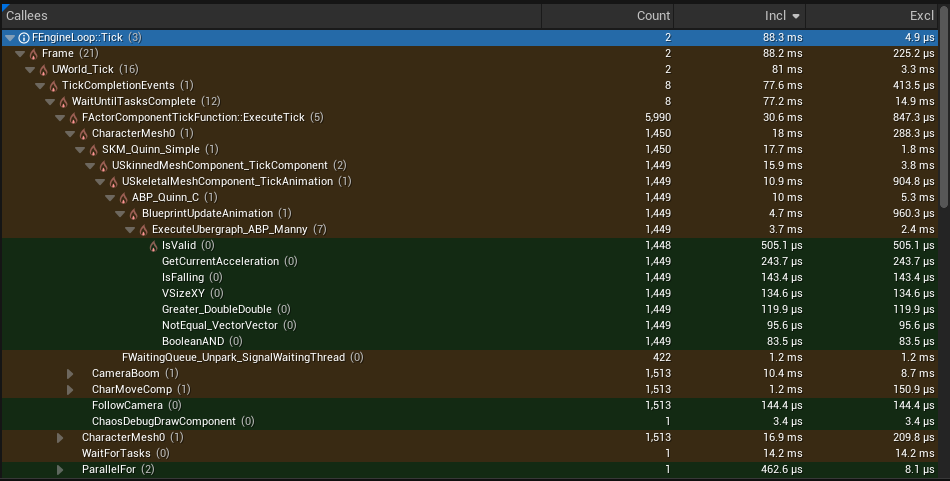
A closeup of just the Callees windows looks like this:
Consider these two methods:
| Method | Count | Inclusive Time (ms) | Exclusive Time (ms) |
|---|---|---|---|
TickCompletionTasks() | 8 | 77.6 | 0.413 |
WaitUntilTasksComplete() | 8 | 77.2 | 14.9 |
Both methods are called 8 times with similar inclusive times but WaitUntilTasksComplete() has a much higher Exclusive time, meaning
more time is spent in that function rather than in it children.
Looking at the Timings view focusing on WaitUntilTasksComplete():
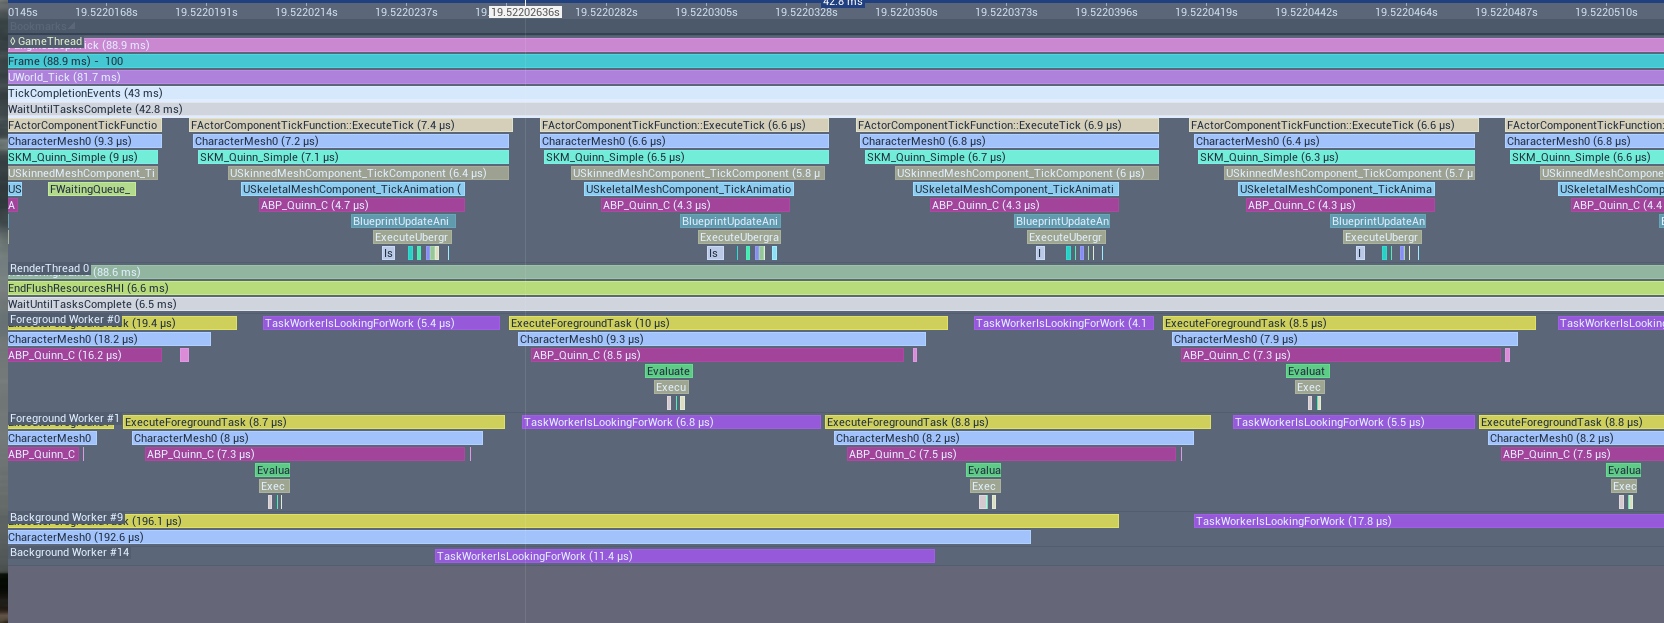
We can see that WaitUntilTasksComplete() is calling FActorComponentTickFunction::ExecuteTick(). From the Callees count column
we see this is called 5,990 times, as we have 1500 actors with 4 components each = ~6000 ticked components. Clearly we are ticking
a lot of unnecessary components (such as cameras on enemies) and we will look at that in the next article, but for now we are just looking at what we can
discern using Insights.
Also clear in the lower part of the above image is that we are creating tasks and these are executing on the forground worker threads. These are executing ABP_Quinn_C which is the the animation blueprint for each enemy. But it is not clear which game thread timing events relate to which foreground worker threads. Associating tasks across threads is the subject of Part 4.
Reference
Feedback
Please leave any feedback about this article here