Optimization Part 2 - A Simple Test Program
This page describes a simple test project which can be used to experiment with optimization in Unreal Engine. The test project is created based on the Game | Third Person | C++ project including the starter content.
The picture below shows the layout of the test map:
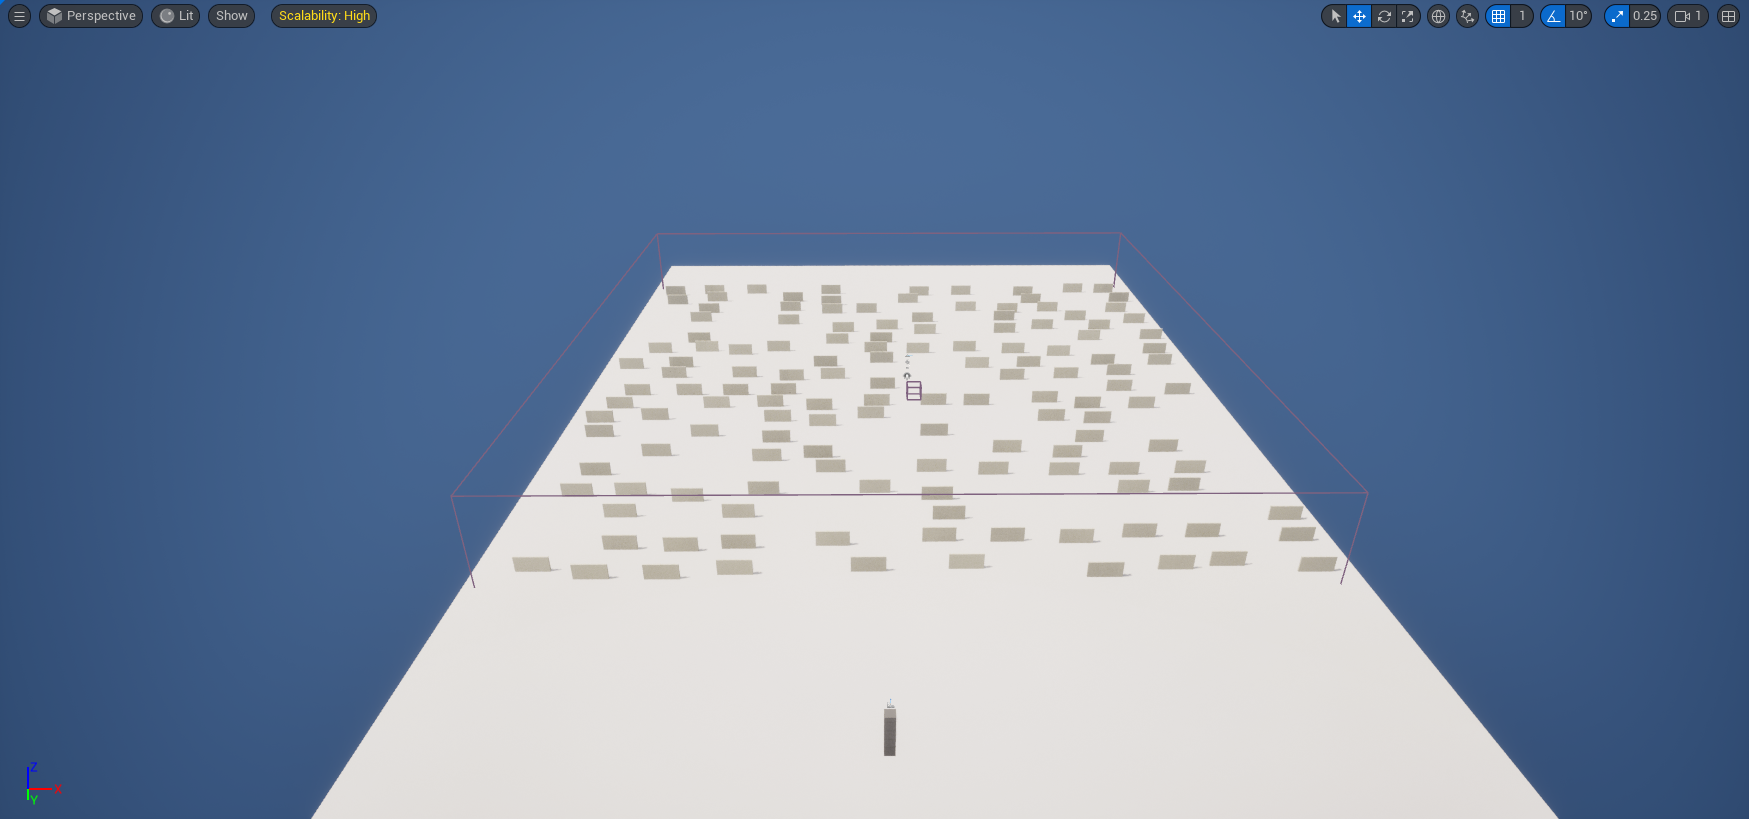
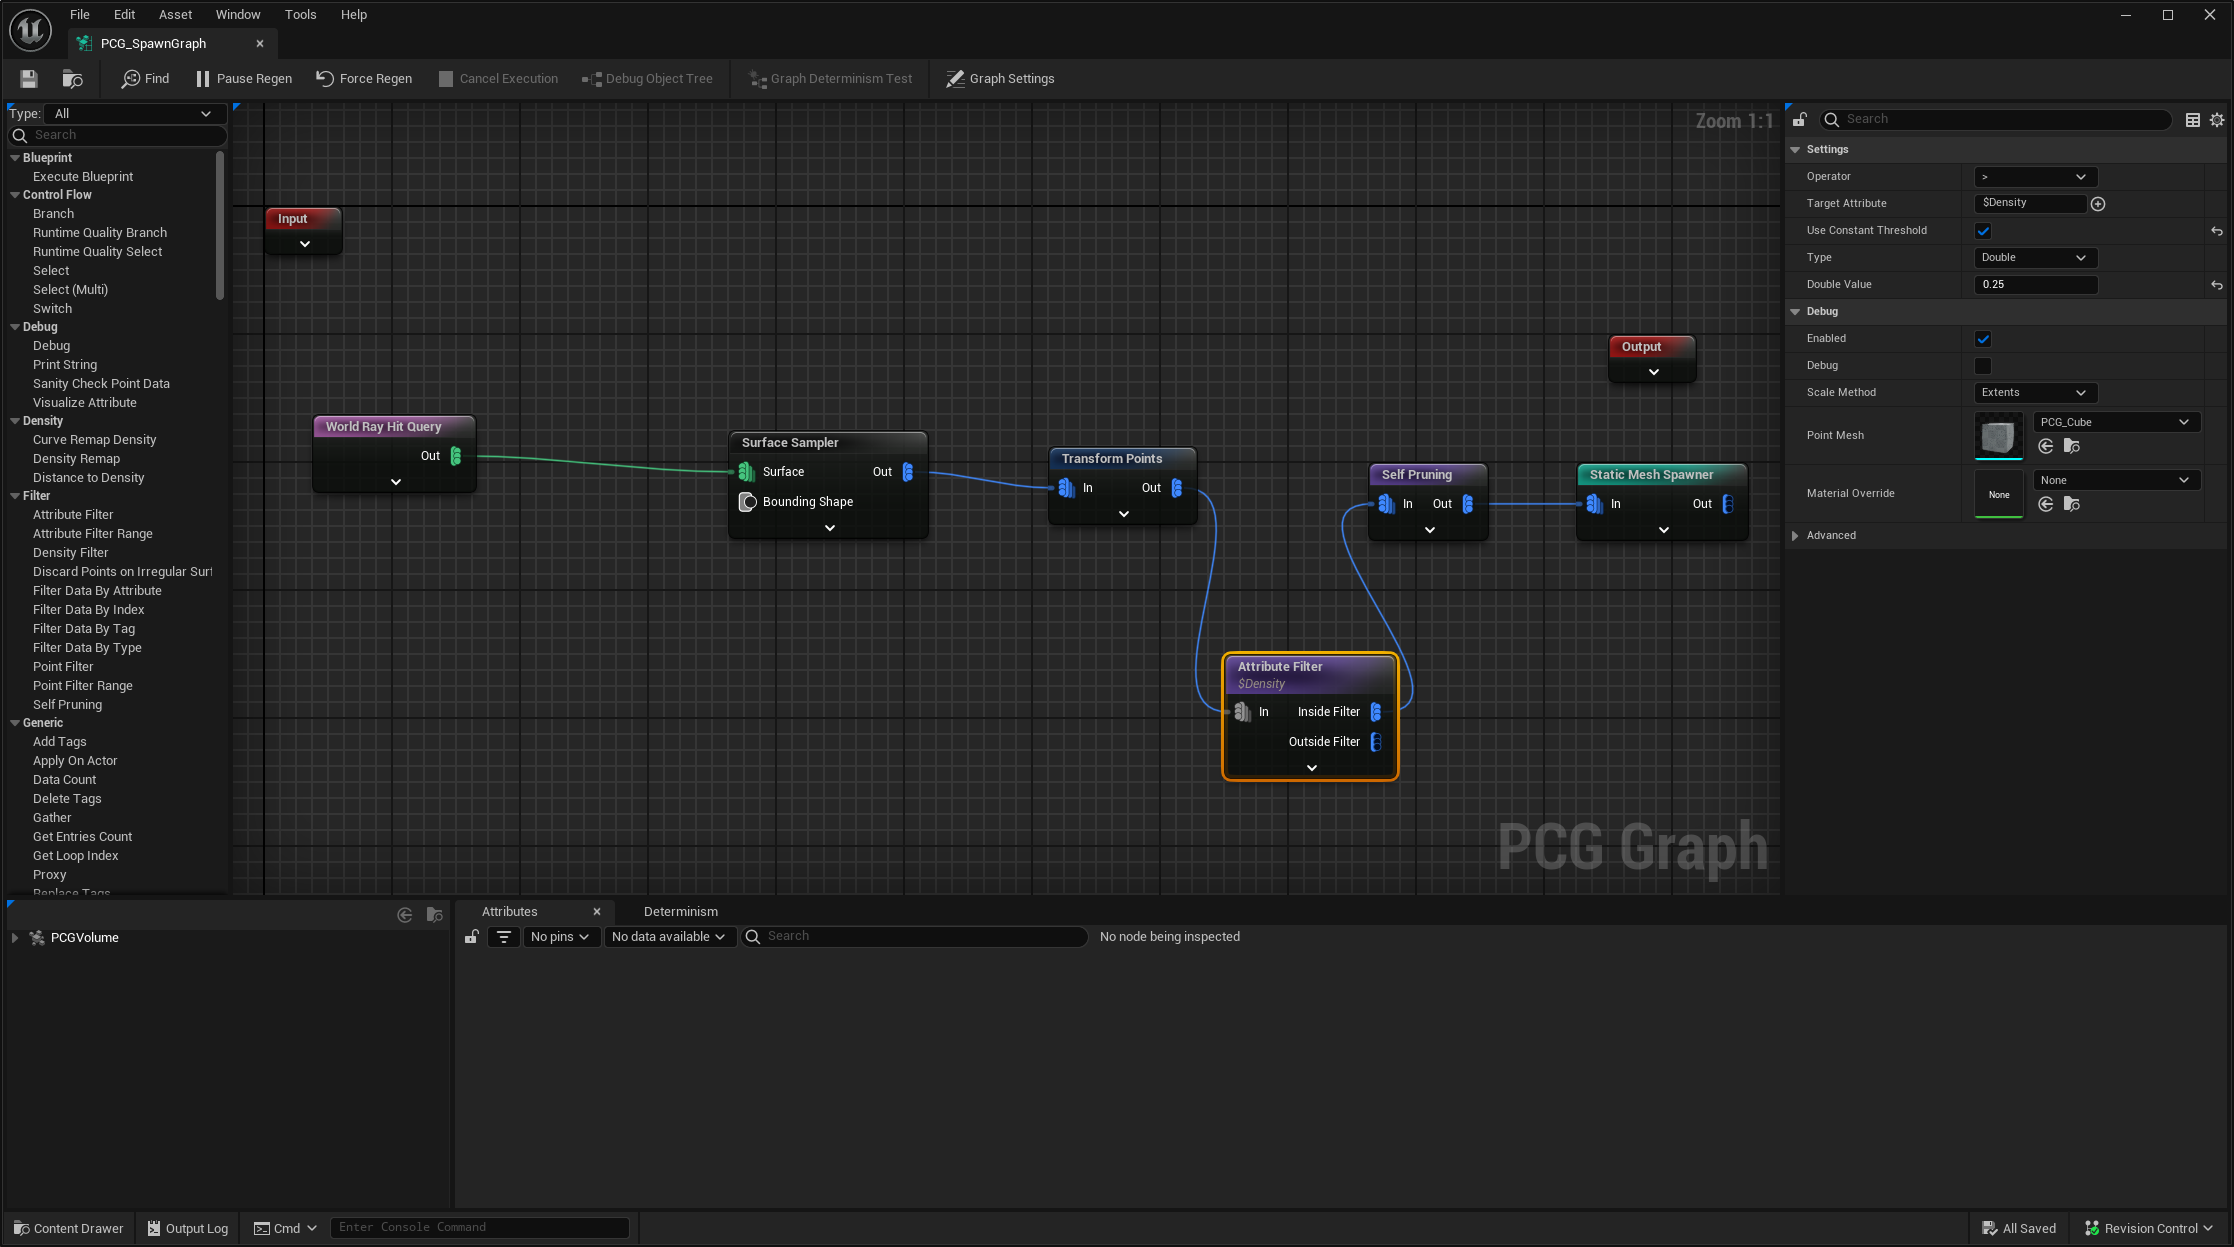
The map has a simple floor created from the default cube object, and a set of small walls. The walls are the static mesh Wall_400x200 (from the starter content) placed using this PCG graph:
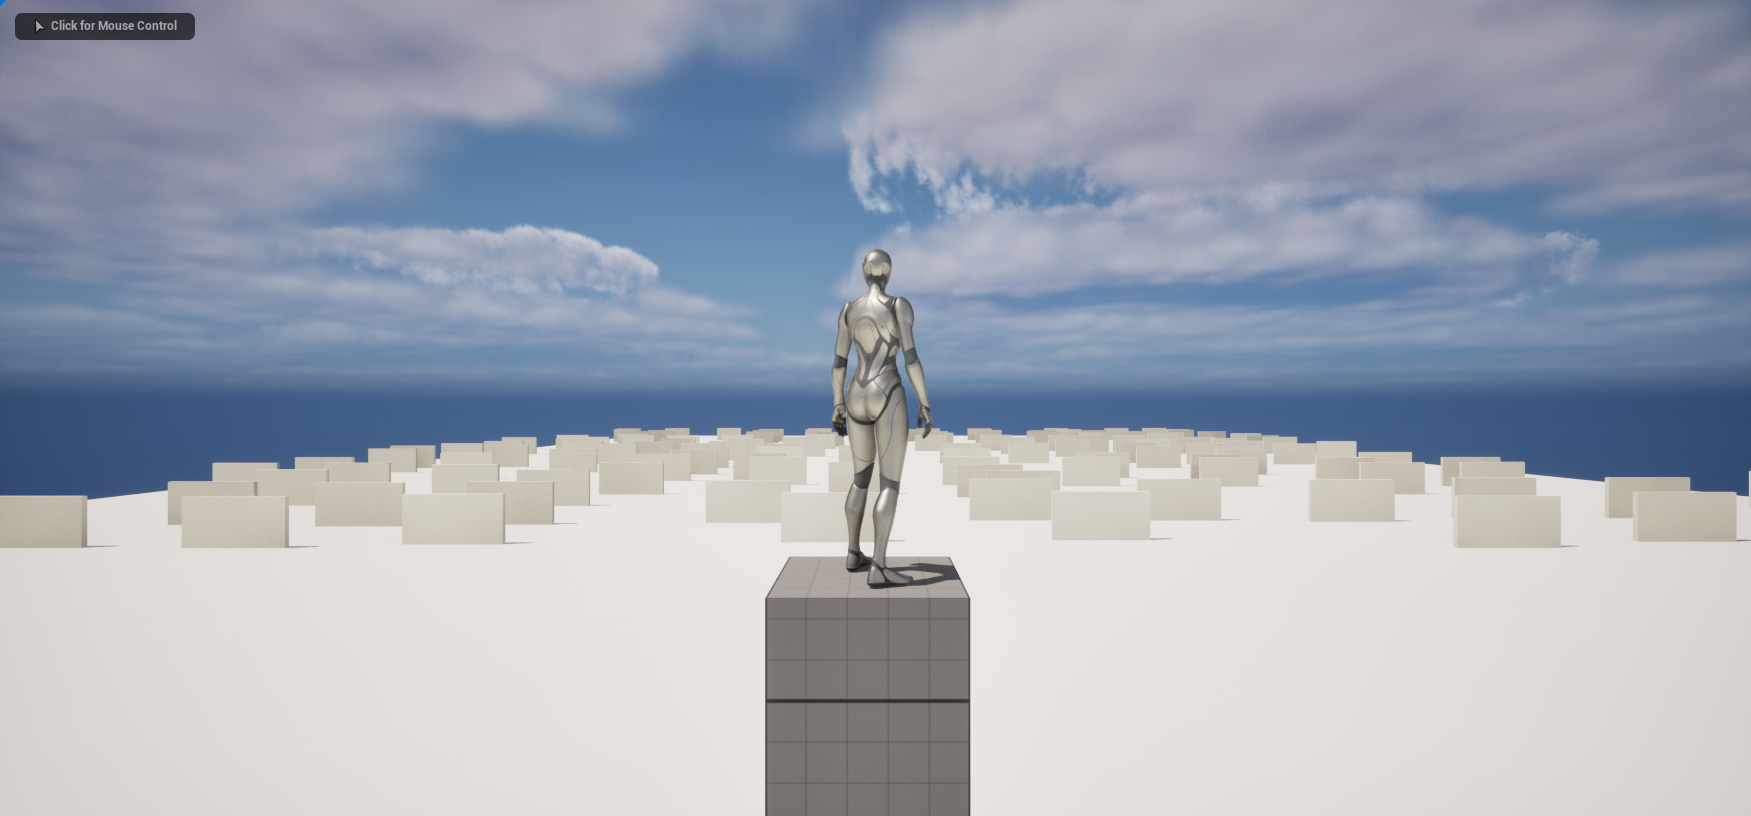
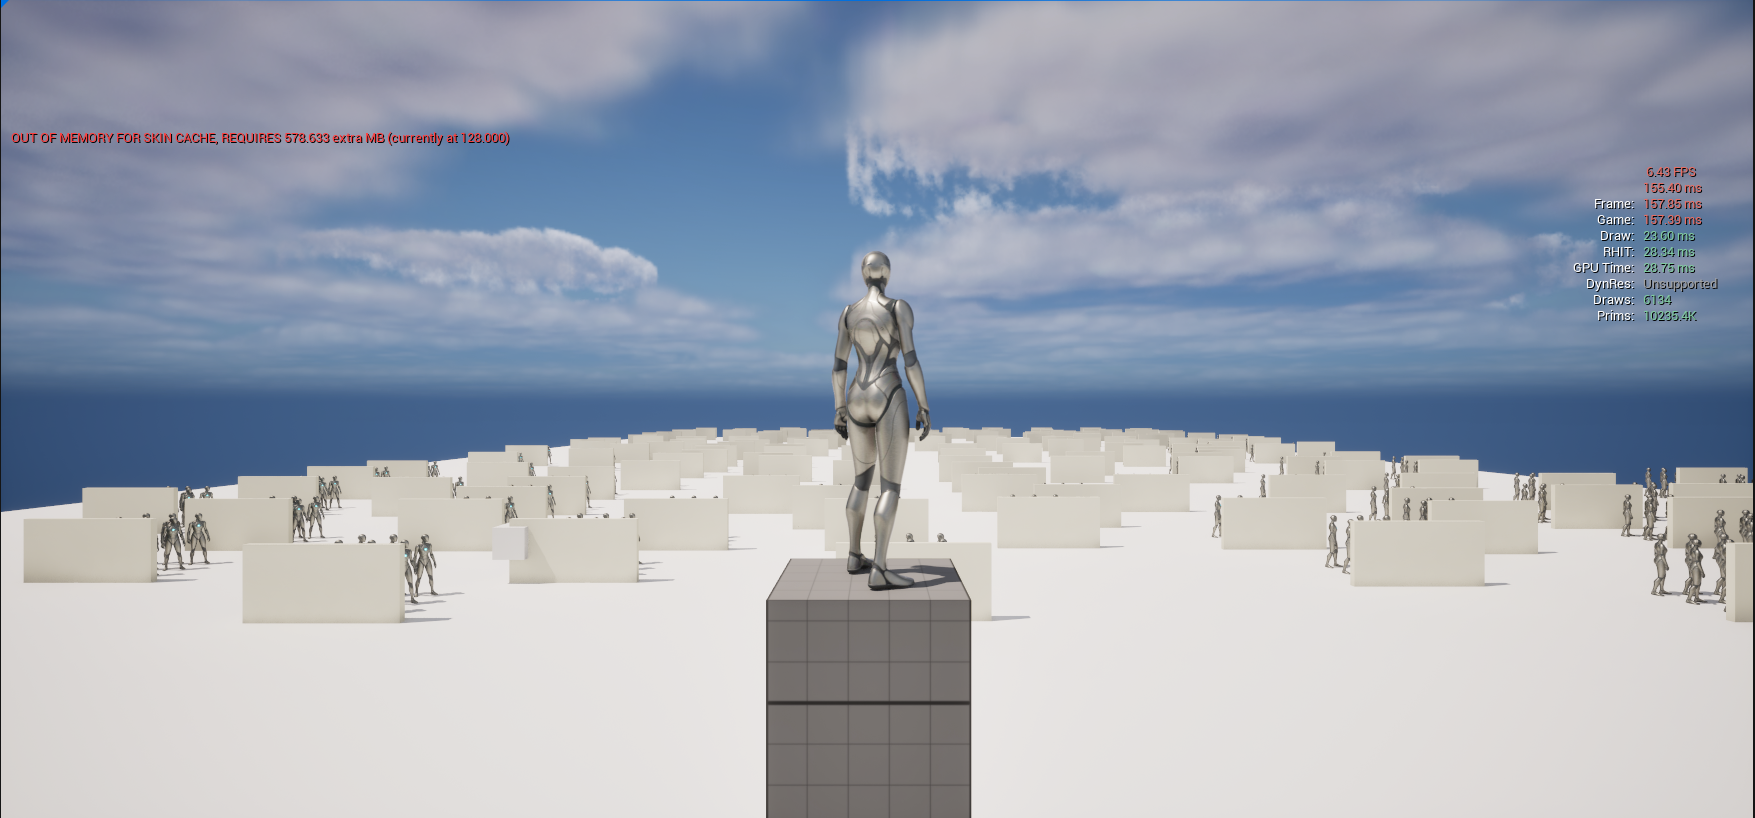
The player start point is in an elevated position at one end of the map. This provides this view over some of the walls:
Screen Resolution
We will be testing with different build configurations such as running in the editor and running standalone. To ensure that the we have consistent screen resolution across configurations we add this code to the game mode to set the screen resolution to 1920x1080. Without this the standalone windows opens at full screen with maximum resolution:
void ASpawnGameMode::StartPlay()
{
	Super::StartPlay();
	FSystemResolution::RequestResolutionChange(1920, 1080, EW indowMode::Windowed);
	...
}
Setting the screen resolution in this way effects both the "Standalone" and "New Editor Window (PIE)" options from this menu:
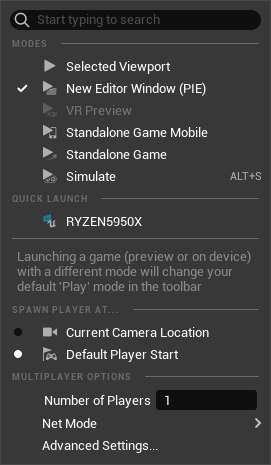
It does not effect the "Selected Viewport" option, in which the window remains at the size it appears in the editor.
Stats
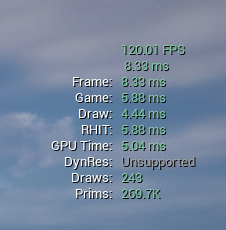
The console commands "stat unit" and "stat fps" will display these stats:
The project has this code in the game mode to enable these stats:
void ASpawnGameMode::StartPlay()
{
	...

	if (UWorld* World = GetWorld(); World && GEngine )
	{
		const TArray<FString> StatNames = { TEXT("fps"), TEXT("unit") };

		for( const FString& StatName: StatNames )
		{
			if( !GEngine->GameViewport || !GEngine->GameViewport->IsStatEnabled(StatName) )
			{
				const FString Command ( "stat " + StatName );
				check( GEngine->Exec( World, *Command ) );
			}
		}
	}
}
This code checks if the stat is enabled before setting it is because the command "stat fps" is a toggle. Executing the command when the stat is already enabled disables it. If the game is run twice with the "New Editor Window (PIE)" option, the first run will enable the option and, because the game is run in the same process as the editor, when the game is run the second time the stat will already be enabled. In this case we don't want run the command again which would result in the stat being disabled.
Editor FPS Stats
To remove the default limit of 120 fps in the editor use this command:
t.MaxFPS 400
The scalability settings ( Setting | Engine Scalablity Settings) in the editor effect the fps. Without any spawned actors except the player in the map, just with the walls, the scalability settings effect fps like this:
| Scalability | FPS |
|---|---|
| Low | 180 |
| Medium | 135 |
| High | 130 |
| Epic | 120 |
| Cinematic | 102 |
This is mainly irrelevant because it depends on so many other settings:
- nanite
- lumen
- Settings | Preview Platform - SM5, SM6 etc.
Injecting Actors
The code in this actor will find walls on the map and create a number of actors behind each wall. This should generate enough actors to slow the game down and for a basis for exploring optimization. This is not done with PCG because I want to be able to change the behaviour of the spawned actors (such a enabling ticking) to see what effect this has.
void ASpawnMother::BeginPlay()
{
	using FVector2 = UE::Math::TVector2<FVector::FReal>;

	Super::BeginPlay();

	int32 CountSpawned{ 0 };

	// spawn some more players
	if (UWorld* World = GetWorld(); PawnClass && TargetStaticMesh && World )
	{
		// find all actors of the target object class (which is a wall) and spawn adjacent to them
		TArray<AActor*> PCGVolumes;
		UGameplayStatics::GetAllActorsOfClass(World, APCGVolume::StaticClass(), PCGVolumes);

		for (const AActor* PCGVolume : PCGVolumes)
		{
			const TArray<UActorComponent*>& PCGVolumeInstanceComponents
				= PCGVolume->GetInstanceComponents();

			for (UActorComponent* Component : PCGVolumeInstanceComponents )
			{
				if (!Component) continue;

				if(UHierarchicalInstancedStaticMeshComponent* InstancedComponent =
							Cast<UHierarchicalInstancedStaticMeshComponent>( Component ))
				{
					constexpr bool bInWorldSpace{ true };
					const int Count = InstancedComponent->GetInstanceCount();

					// get the dimensions of the static mesh
					TObjectPtr<UStaticMesh> Mesh = InstancedComponent->GetStaticMesh();
					if (!Mesh) continue;

					// configure spawning
					const FRotator Rotation{ FRotator::ZeroRotator };
					FActorSpawnParameters SpawnParameters;
					SpawnParameters.Name = "Test";
					SpawnParameters.NameMode = FActorSpawnParameters::ESpawnActorNameMode::Requested;

					// BoxExtent to distance from center to bounds so *2 to get dimensions
					const FBoxSphereBounds Bounds = Mesh->GetBounds();

					// where are we positioning the set of actors
					FVector2 ActorDropZone{ double(NumX - 1) * Spacing , double(NumY - 1) * Spacing };

					// spawn actors
					for (int i = 0; i < Count; ++i)
					{
						FTransform InstanceTransform;
						InstancedComponent->GetInstanceTransform(i, InstanceTransform, bInWorldSpace);

						FVector Center = InstanceTransform.GetLocation() + Bounds.BoxExtent + SpawnOffset;

						// push center away from wall
						Center.Y -= ActorDropZone.Y * 0.5f;

						const FVector2 StartOffset{ -ActorDropZone * 0.5f };

						FVector SpawnLocation( Center.X + StartOffset.X,
							Center.Y + StartOffset.Y, 0 );

						for (int IX = 0; IX < NumX; ++IX )
						{
							for (int IY = 0; IY < NumY; ++IY)
							{
								World->SpawnActor( PawnClass, &SpawnLocation, &Rotation, SpawnParameters );
								SpawnLocation.Y += Spacing;
								CountSpawned++;
							}
							SpawnLocation.X += Spacing;
							SpawnLocation.Y = Center.Y + StartOffset.Y;
						}
					}
				}
			}
		}
	}


	UE_LOG(LogTemp, Warning, TEXT("Spawned %d new actors"), CountSpawned);
}
With 1500 Actors
Timings vary depending on screen resolution, build configuration and project settings.
Timings in different configurations show these figures:
| Configuration | Description | Running | FPS |
|---|---|---|---|
| Debug Editor | Everything build in debug mode | editor standalone | 1 |
| Debug Editor | Everything build in debug mode | editor new window(pie) | 1 |
| DebugGame Editor | Editor in release mode, our code in debug mode | editor standalone | 9 |
| DebugGame Editor | Editor in release mode, our code in debug mode | editor new window(pie) | 10 |
| Development Editor | Everything built in release mode | editor standalone | 9 |
| Development Editor | Editor and our code in release mode | editor new window(pie) | 10 |
| Development Game | Everything built in release mode | game | 13 |
| Shipping | Everything built in release mode | game | 17 |
This doesn't tell us a great deal, just that different configurations run at different speeds. Given that there is little difference between the Debug Game Editor (where our code is in debug mode) and the Development Editor (where our code is in release mode) we can infer our code does not make much difference - which makes sense because our code is only run to configure the project and create the actors, everything after that is run using editor code.
Looking at the Stats
We can look at the stats here:
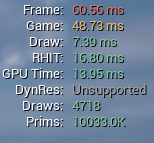
The explanation for these values is:
| Name | Description |
|---|---|
| Frame | Frame time is the total amount of time spent generating one frame of the game. Since both the Game and Draw threads sync up before finishing a frame, Frame time is often close to the time being shown in one of these threads. |
| Game | If Frame time is close to Game time, the game's performance is likely being bottlenecked (negatively impacted) by the game thread. |
| Draw | If Frame time is close to Draw time, the game's performance is likely being bottlenecked by the rendering thread |
| GPU | GPU time measures how long the video card takes to render the scene. Since GPU time is synced to the frame, it will likely be similar to Frame time. |
| RHIT | Typically, RHI Thread time is synced to the frame, and it will likely be similar to Frame time. |
| DynRes | If supported (and enabled), DynRes shows Primary Screen Percentage by Secondary Screen Percentage. |
Only the first 3 are important here. At 60 frames per second that target time to generate a frame is 16.666ms - clearly our 60.59 is way over this. We can see that the Draw time is under that but the Game time (48.73) is over. From this we can infer that the problem is in the game performance rather than the rendering performance.
At this point we will to investigate the slowness in Part 3: Using Unreal Insights
Reference
Feedback
Please leave any feedback about this article here